Title : S-Shaped Growth

|
Location : Home > Methods > Simulation > System Dynamics > Introduction to System Dynamics Title : S-Shaped Growth |
 |
S-Shaped Growth
S-shaped growth is the characteristic behavior of a system in which a positive and negative feedback structure fight for dominance but result in long-run equilibrium. As illustrated in Figure 1, the positive feedback exponential growth loop (shown in blue) initially dominates the system, causing the system variable to increase at an increasing rate. However, as the system approaches its limit or "carrying capacity", the goal-seeking negative feedback loop (shown in red) becomes the dominant loop. In this new mode, the system approaches stasis asymptotically. This "shifting dominance" event from one loop to another is characteristic of nonlinear behavior and is found in a variety of physical, social, and economic systems.
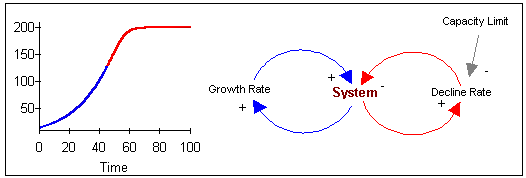
Figure 1: S-Shaped structure and characteristic time path.
For this discussion, we revisit the elephant herd scenario to illustrate this behavior. Figures 2 and 3 present our elephant population model in causal diagram and simulation model form, respectively. Looking at Figure 2, we see that the elephant herd system consists of one positive growth feedback loop and two negative feedback loops.
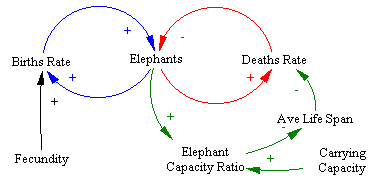
Figure 2: Causal diagram of the elephant population model.
(click on image to run simulation)
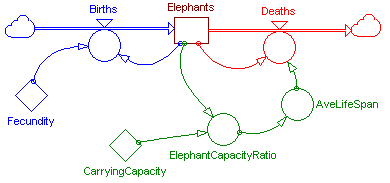
Figure 3: Simulation model of elephant herd growth model.
The positive Birth Rate loop, shown in blue, is responsible for the exponential growth experienced during the early stages of herd growth. As the population of the herd increases, the birth rate - given some Fecundity (fertility) constant - increases. Increasing the birth rate further promotes the growth of the herd. In balance, the negative Death Rate loop, shown in red, is responsible for drawing down the herd population. On its own, the death rate of the elephant herd implicitly reduces the population to zero. As elephants die, the population decreases until an equilibrium population of zero is reached wherein no more elephants die. The negative Carrying Capacity loop, shown in green, considers the effect of an increasing population density on the average life span - and thereby the Death rate - of the elephant herd. Here, the explicit goal of the system is determined by the carrying capacity.
Given this structure, Figures 4 and 5 show the time series results from simulating this model from time=0 to time=100. In Figure 4 ,we see the exponential behavior of the birth rate from time=0 to about time=40. At time=40, the influence of an increasing population density on the average life span begins to show with an "upturn" in the rate of Deaths within the herd. After this point, the gap between Birth and Death rate gradually closes as the population density increases. At about time=58, the Birth and Death rate become equal and the system achieves equilibrium.
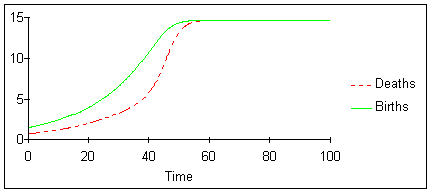
Figure 4: Time series plot of elephant herd Birth rate and Death rates.
To illustrate this behavior another way, Figure 5 shows a normalized time series plot of the Elephant herd population and the Net Growth rate for the herd. Net Growth is defined as the number of elephant births minus the number of elephant deaths. As we expect, initially the Net Growth increases exponentially due to the dominance of the Birth rate loop. However, we see a very specific shift at time=40 when the Net Growth peaks and begins to fall. As the rate of death increases, the Net Growth decreases. The continued increase in Death rate eventually brings Net Growth to zero, causing the system to reach steady state.
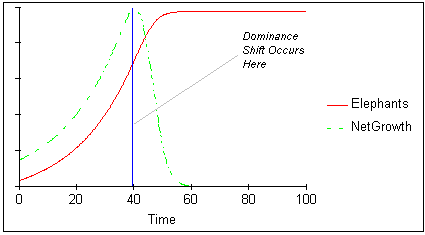
Figure 5: Normalized time series for Elephant population and Net Growth indicates that shift occurs at maximum growth point.
Overshoot and Collapse
So far, we have considered a system in which the carrying capacity is constant. Now, let us examine the case in which a system overshoots its limit, causing the carrying capacity itself to change. In such cases, three outcomes are possible depending upon the specific structure of the system. The system may:
In order to demonstrate overshoot and collapse behavior in our elephant model, we have to add some structure. As shown in Figure 6, we assume that the system's carrying capacity is actually a stock of resource, such as acres of grass and shrubbery, with some characteristic yearly average output. If the herd population is below the land's ability to replenish itself, then the carrying capacity is constant. However, if the consumption rate of the elephant herd exceeds its steady state carrying capacity, then land's ability to regenerate is eroded by some amount. The Erosion Rate in this case is defined as the number of elephants in the herd multiplied by the yearly erosion rate per elephant. (click on image to run simulation)
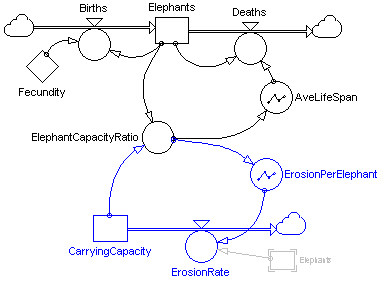
Figure 6: Elephant population model with variable carrying capacity.
Figure 7 shows the results of a simulation run from time=0 to time=100 with an initial herd population of 50 elephants. In this case, the herd exceeds the initial Carrying Capacity at about time=20. After some delay, this excess number of elephants begins to erode the Carrying Capacity. Since the Carrying Capacity serves as the target in this negative feedback system, the Elephant population responds in kind by reversing its exponential growth and follows the Carrying Capacity downward. Note that even when the population drops to 200 animals, the initial Carrying Capacity, it remains greater than the now decreasing Carrying Capacity, thus the process continues until the system crashes and the Carrying Capacity of the land becomes zero.
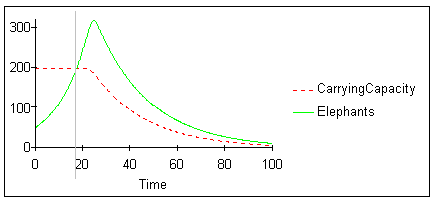
Figure 7: Results from Elephant population overshoot scenario.
[Previous] |
[Next] |
 |
Update : 2005/07/23 |